Pdf reports in SQL Server
02-04-2016 15:15You probably already know you can use Microsoft SQL Server Reporting Services or SAP Crystal Reports to generate pdf reports from your SQL Server datasource. In this post I'll give you the alternative to these tools and show you how to render reports from SQL Server in completely different way. In the flexible way which is based just on html and javascript. There won't be any frustration from using limited designers or proprietary report formats, I promise.
javascript based reporting
The alternative I'm gonna show you is the tool called jsreport. jsreport is cross platform solution which was designed to change the report generation process with emphases on flexibility, openness and standards. With jsreport you mostly fetch the report datasource with javascript, design the report with html/css and let jsreport to print it into pdf or other formats. It's this simple, there is no learning curve, no limitations and you can simply design reports you really want. I'll show you now how to use jsreport to directly load the datasource from SQL Server, design a fancy report and also how to use jsreport API to integrate it in the existing application.
Prepare jsreport
The official jsreport package is distributed through npm. You can find the installation instructions for each platform in the download section here. After you follow the installation steps you should be able to reach jsreport studio in the browser.
Now I'll continue to show you the integration with SQL Server, if you are eager to learn more about jsreport right away, you can switch to get started article first.
I expect you have jsreport already running now. However, to be able to load data from SQL, you need to install additional module which provides this functionality. In this tutorial I use mssql node package, but you can use also any other. To install it you simply type
npm install --save mssql
This module must be also explicitly allowed in jsreport configuration because by default are all additional modules blocked for security reasons. This is done by adding following section into jsreport.config.json file, which was created during the installation.
   ...
   "extensions": {
     "scripts": {
        "allowedModules": [ "mssql"]
     }
   }
Restart jsreport and proceed to the next step.
Prepare input data source
The first step is to prepare the input datasource for the report. In this example I will fetch the data from the SQL database using custom script and as the datasource I'll use standard northwind.
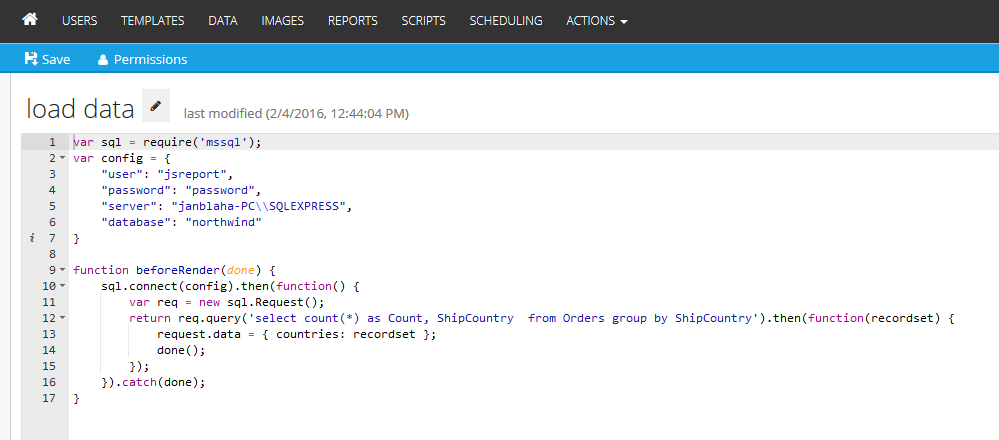
Now I create the script using jsreport studio ACTIONS/Create script. This will be the script running in jsreport server and fetching datasource. It should look the following way.
const sql = require('mssql');
const config = {
    "user": "jsreport",
    "password": "password",
    "server": "janblaha-PC\\SQLEXPRESS",
    "database": "northwind"
}

async function beforeRender(req, res) {
    await sql.connect(config)
    const sqlReq = new sql.Request();
    const recordset = await sqlReq.query(
        `select count(*) as Count, ShipCountry
         from Orders group by
         ShipCountry`
    )
    Object.assign(req.data, { countries: recordset });
}
There is no magic in here, this is the plain javascript using mssql to which you can find the full documentation and reference on github. jsreport invokes its function beforeRender just before the report rendering starts and then reads back data which were set to request.data. Lets test this script and design the report layout now.
Design report layout
Now you should create report template using jsreport studio ACTIONS/Create template and associate previously created script with the new template.
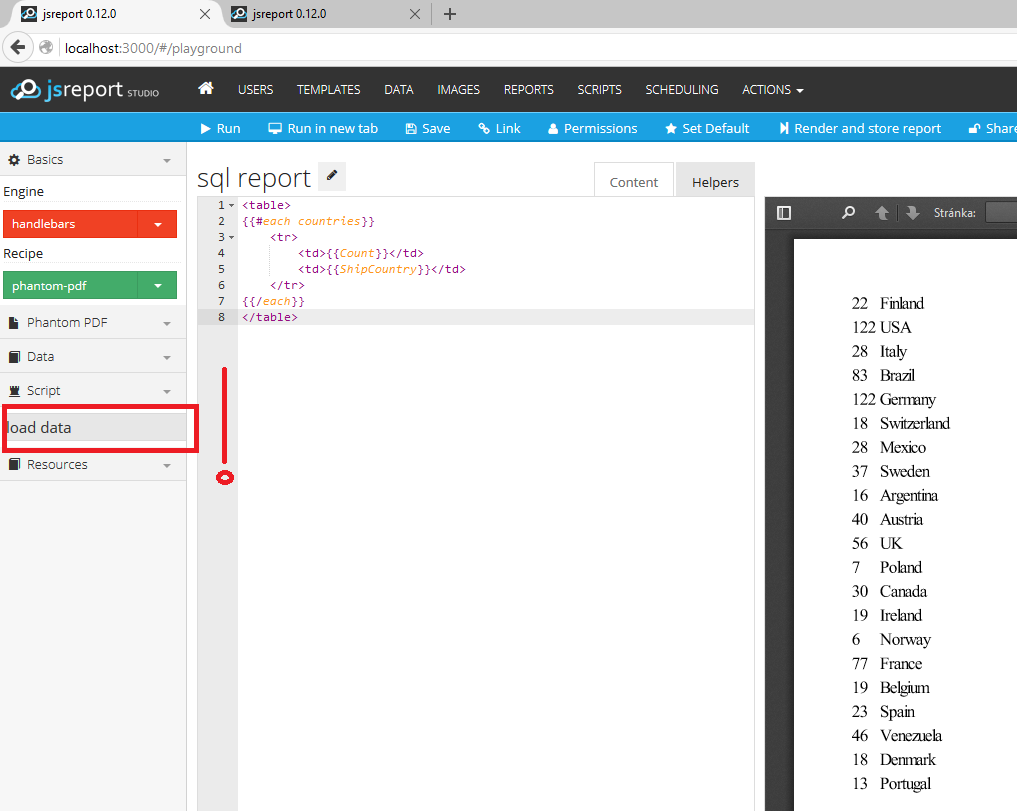
To design the report I use html together with handlebars templating engine. This allows me to dynamically create the layout based on the input data. I can for example iterate over data and print a table from it.
<table>
{{#each countries}}
    <tr>
        <td>{{Count}}</td>
        <td>{{ShipCountry}}</td>
    </tr>
{{/each}}
</table>
If you run such a template you see it produces pdf right away. This is because of selected phantom-pdf recipe. The jsreport recipe is an algorithm responsible for assembling the report output and this particular one is using phantomjs to convert html into pdf. You can also try a different one like html-to-xlsx which prints excel.
Charts
Lets add a chart to the report. jsreport doesn't limit you with a predefined chart type like other tools do. You can choose from thousands of already existing javascript libraries and use it. I'll use popular highcharts now.
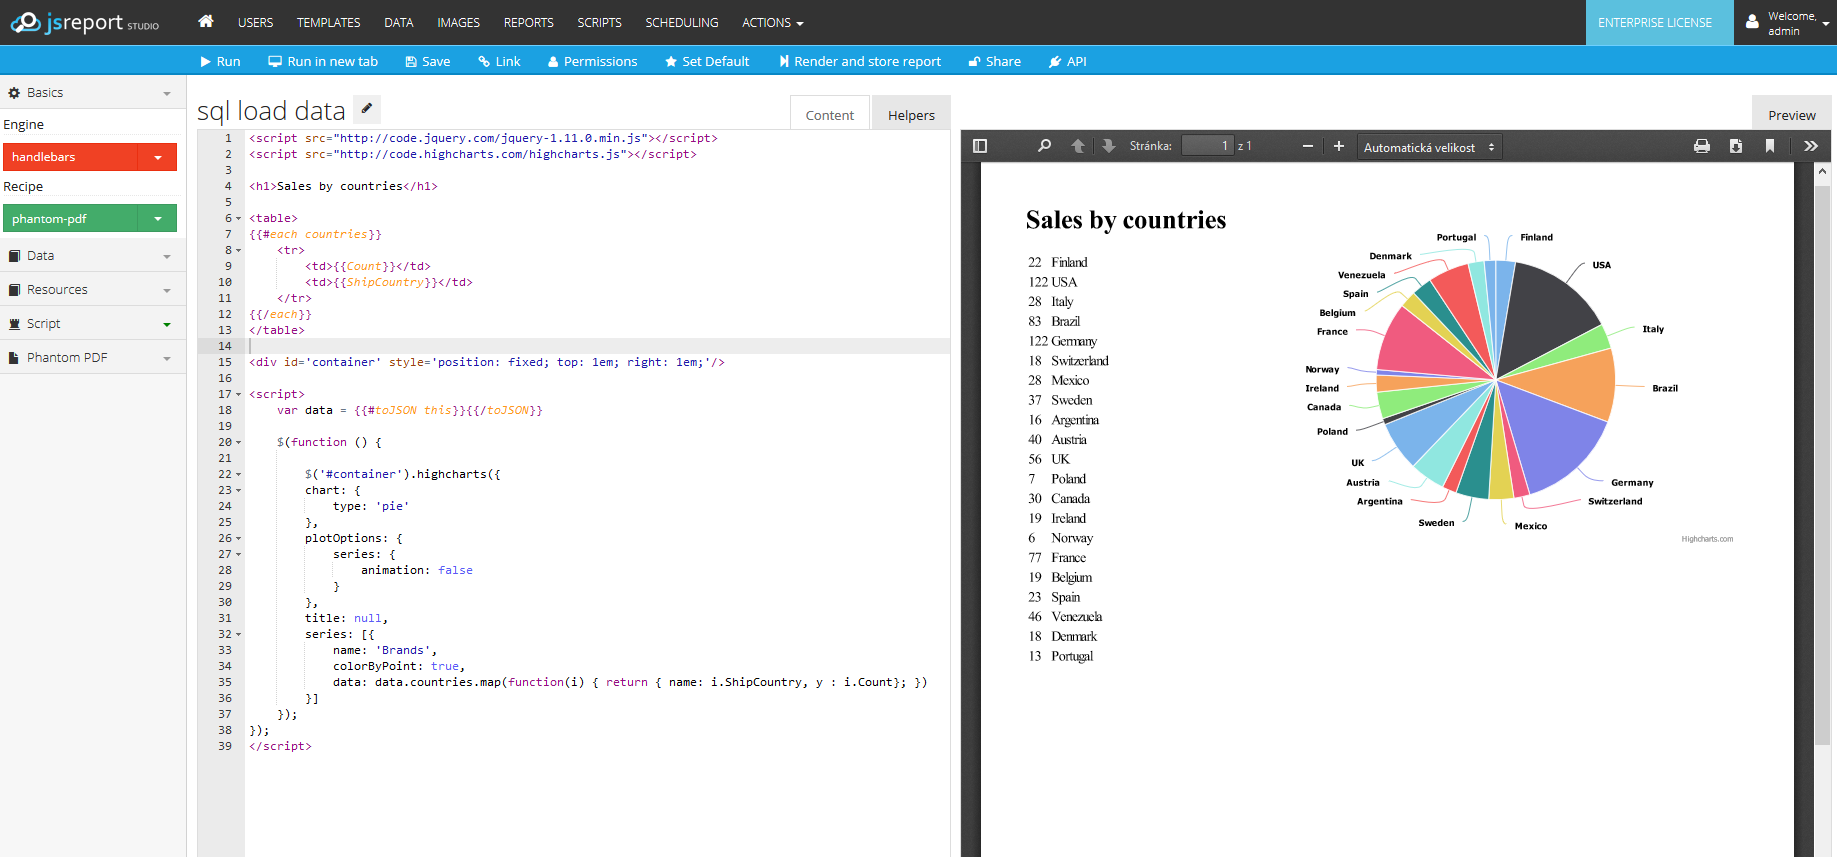
You can find many examples in the highcharts documentation and everything will run in jsreport as well and produces pdf. You only need to always turn off animation, otherwise the pdf won't contain complete chart.
I want to render a pie chart from the data I prepared in the script now. To push the data into the chart I use a little trick I described here. I create a custom helper function in the studio helpers tab.
function toJSON(data) {
  return JSON.stringify(data);
}
And use this helper to create the input data object inside template's script tag. This is a bit tricky and not obvious, but you should be able to understand it from the mentioned blog post. The final template content then looks the following.
<script src="http://code.jquery.com/jquery-1.11.0.min.js"></script>
<script src="http://code.highcharts.com/highcharts.js"></script>

<div id='container'/>

<script>
    var data = {{#toJSON this}}{{/toJSON}}
    $(function () {
        $('#container').highcharts({
        chart: {
            type: 'pie'
        },
        plotOptions: {
            series: {
                animation: false
            }
        },
        title: null,
        series: [{
            name: 'Brands',
            colorByPoint: true,
            data: data.countries.map(function(i) { return { name: i.ShipCountry, y : i.Count}; })
        }]
    });
  });
</script>
Running this template you should see a nice pie chart in pdf format.
Use API to render report
When you have the report template ready, you can integrate jsreport through API to your system. This is usually done though just one REST call which invokes the report rendering and streams back the pdf.
POST:https://jsreport-host/api/report
Headers: Content-Type: application/json
BODY:{ "template": { "name" : "sql report" } }
You can find the full API documentation here.
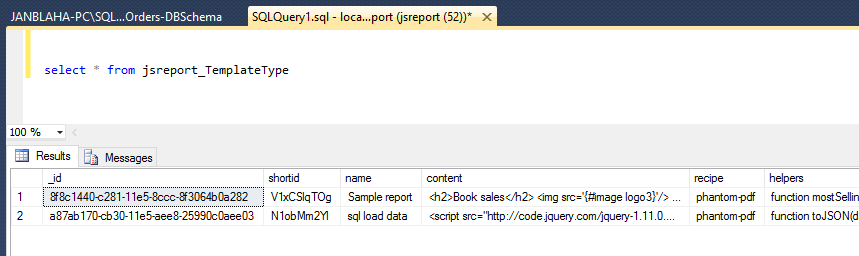
Store reports directly in sql server
jsreport stores templates in the file system by default. If you want to have everything in one place inside SQL Server you can simply configure jsreport to use it also for storing templates
Install package jsreport-mssql-store
npm install --save jsreport-mssql-store
Change the connection string in jsreport.config.json
 ...
 "store": {
        "provider": "mssql"
},
"extensions": {
        "mssql-store": {
            "user": "jsreport",
            "user": "jsreport",
            "password": "password",
            "server": "janblaha-PC\\SQLEXPRESS",
            "database": "jsreport"
        }
}
Restart jsreport server and the templates should be stored inside SQL Server afterwards.
Summary
You see you can easily integrate jsreport with your SQL Server database and design flexible reports using knowledge you already have - javascript with html.
I revealed only small part of jsreport in this tutorial. There is much more including scheduling, permission delegating and more than 30 other extensions available. If you like jsreport and want to know more you can see deep dive sceencast or navigate to learn section.