Dynamic excel pivot table
This tutorial shows how to dynamically create an excel with pivot table using jsreport and its xlsx recipe.
We won't create the whole excel from scratch, much easier is to prepare a template directly in excel and then fill it with data using jsreport. Let's start with the excel part first.
Excel template
We're going to need two sheets for the tutorial, one with the actual pivot and the second containing the raw data.
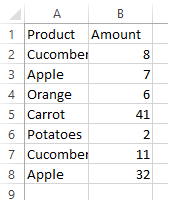
Add the second sheet, rename it to Data and add a simple two columns table.
Then switch to the first sheet and create a pivot table based on the second sheet and select both Product and Amount as Pivot Chart Fields.
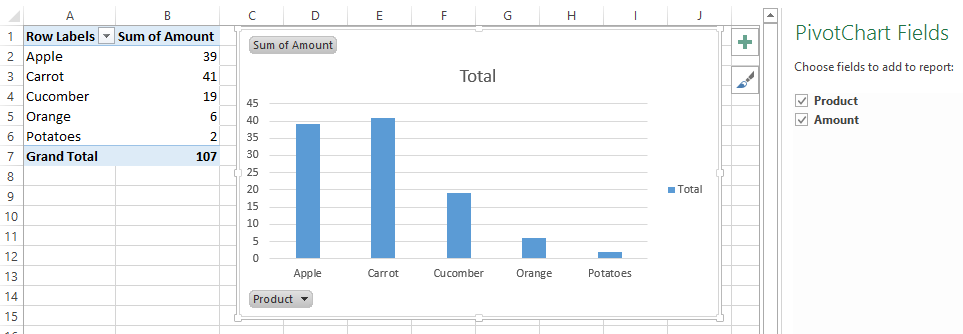
Now we have static pivot table. You may notice that the pivot doesn't automatically refresh if you try to add another product to the Data sheet. This need to be changed and we need to make the pivot data range dynamic before inserting rows from jsreport.
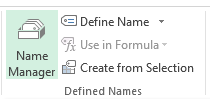
Dynamic data range can be specified using the new custom excel formula. Switch to FORMULAS ribbon tab and open Name Manager.
Now create new formula named MyData using OFFSET function
=OFFSET(Data!$A$1,0,0,COUNTA(Data!$A:$A),2)

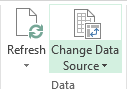
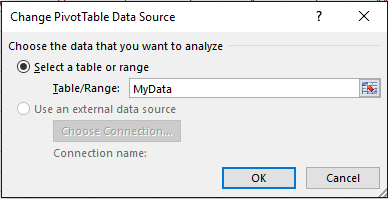
This formula dynamically selects all filled rows. Now we need to change pivot data source to use it. Select pivot table and find Change Data Source in the ribbon.
Choose the previously created MyData formula as Range.
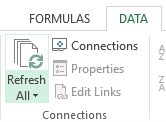
Now you can try to add a row to the Data sheet and click Refresh All from the ribbon. You should see the pivot is correctly refreshed.
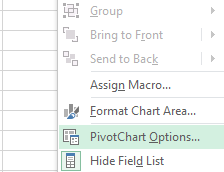
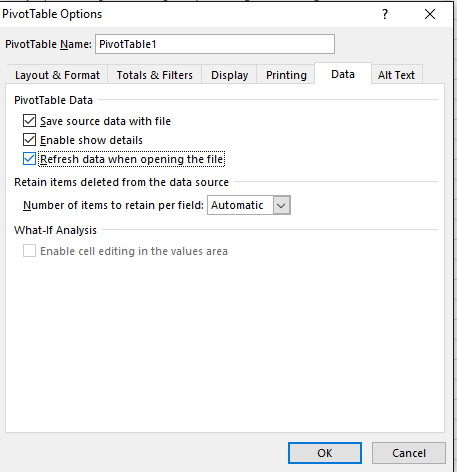
Additionally it's nice to have the pivot automatically refreshed after the excel is loaded. This can be enabled from the pivot context menu.
At the end remove the rows from the Data sheet and keep only the header.
Render excel in jsreport
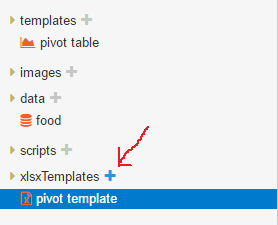
Now you can switch to the jsreport studio and upload the previously created excel template.
Create also a data entity with some test data for the report
{
    "food": [{
        "Name": "Cucomber",
        "Amount": 8
    },{
        "Name": "Apple",
        "Amount": 7
    }
}
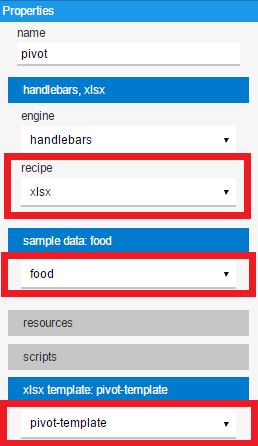
Afterwards create a report template with xlsx recipe, selected the excel template and the test data.
Now it's time to define the excel report content. This gonna be quite easy because we've already prepared the excel template and the only thing to do is to iterate over the input data and add rows to the second sheet. This can be done using handlebars templating engine and helper function xlsxAdd provided by xlsx recipe.
{{#each food}}
{{#xlsxAdd "xl/worksheets/sheet2.xml" "worksheet.sheetData[0].row"}}
<row>
    <c t="inlineStr"><is><t>{{Name}}</t></is></c>
    <c><v>{{Amount}}</v></c>
</row>
{{/xlsxAdd}}
{{/each}}

{{{xlsxPrint}}}