Pdf reports in c#
04-18-2014 12:53Update 2: There is new .NET jsreport sdk available with breaking changes which makes examples presented here outdated. Please follow the videos and example in the sdk documentation to get the up to date information.
Update: This article compares current approaches for printing pdf reports from c# and highlights jsreport as solution for problems related to reporting in c#. We have recently released jsreport visual studio tools that make things much more easier. See reporting visual studio extension and reporting embedded into .net documentation. You can also find interesting full tutorial for reporting in asp.net mvc.
Introduction
To output a pdf business report is a typical requirement for almost every enterprise solution. I was implementing this use case for many companies and I was having hard time doing it. That made me think if I am doing it actually right. This article tries to summarize solutions I have tried or found and finally describes in detail how to render pdf reports using jsreport.
Existing solutions
iTextSharp
iTextSharp is port of java iText library. It allows to define pdf using c# in imperative way. This means that you are assembling pdf step by step calling iTextSharp c# functions. Creating document imperatively is not very good. It has the same problems as constructing html web site in c# instead of asp.net Razor. It would result into very unreadable code. For this reason I would skip into next option.
Telerik Reporting, DevExpress reporting, Crystal Reports
Another solution very popular in .NET world is to use one of the listed reporting tools. The main idea of these tools is very similar. They are providing integrated designer into Visual Studio, where developer can define report just by clicking into WYSIWYG editor. This sounds very good, because it allows reports to be created by non-developers. But as everything else, it also has its pitfalls.
The first problem is that there is no WYSIWYG editor in the world able to define every report. Some reports can have such a complex layout that it is impossible to handle using a visual designer. You are probably also just typing html in Visual Studio instead of using a designer. This is the same case. It is great to use visual designer when you need to do something simple but it is big pain when you need to do something complex.
The second problem relates to report helper functions and c#. Reports usually need some helper functions to sort the table inputs or find the row to be highlighted. Mentioned tools are using c# to write report helper functions. This is just a bad idea. No doubt that c# is one of the best programming languages. But it was never meant to be a scripting language. Helper function is a typical script task, where you just want to write quickly the function and see the result. You definitely don’t want to recompile or even redeploy the whole solution.
The first and the second problem does not need to be necessarily critical. If the reports are not very complex and you are not changing them often, the work with UI report designer can be quite productive. But if you have very complex reports or want to modify them in a team, you'd better continue to the next options.
Html to Pdf conversion
Html into Pdf conversion was always an option. The problem with this approach used to be a lack of maturity of the tools doing the conversion. But this is not a problem anymore. Tools like wkhtmltopdf or phantomjs are already matured and working great. Integration with .NET is very straightforward. These tools are running like a command line applications so you can easily send html to them in command parameter and get back the pdf in couple of seconds. The last question is how to produce html from .NET code. The best way is to let the asp.net razor view generate the html for you. Now you can just transform it into pdf and you are done.
This approach doesn't have any limitations in visual designer and the report code is declarative html that is nicely readable. It has only several pitfalls you can solve or look at the last approach. This first problem is that you still need to recompile when doing changes in reports. Second trouble is you need to build some infrastructure around. Like communication with the conversion tool, images exposing or base64 encoding and catching razor output. You also need to assure the conversion tool is present on every machine you are running on.
jsreport
The last and final approach is to use reporting software jsreport. It provides multiple ways how to render pdf, but probably the most used one is also based on transforming html into pdf. jsreport is javascript based reporting server, that wraps the infrastructure needed from previous approach and makes pdf generation easy. Since it's based on javascript, you won't use asp.net razor to build html but javascript templating engines like handlebarsjs instead. This allows to build any required complex report and modify it during runtime without any recompilation. Let’s look now how to create first report and render it from .net sdk using jsreport.
Example
The finall code from jsreport is accessible here The Visual Studio project is stored at github
Let's say we are implementing system for local library and we need to generate monthly pdf report containing table of sold books, the best selling book and a chart highlighting books sales. All of this should be achieved using c# and entities from Library system. We will first prepare report layout in jsreport and then we will call its api to get report from c#.
jsreport is reporting server and in order to generate pdf reports you need to have access to it first. You have three options. You can use jsreport as on premisse reporting, you can also register for cloud based SaaS reporting or you can use an online lightweight playground for free. For this example the lightweight playground is enough so let’s create the first report there.
Go to https://playground.jsreport.net. You should see studio dedicated to design reports. It's a bit limited but similar experience to what you would have when you have installed full jsreport on your server. We will design the library report in this studio.
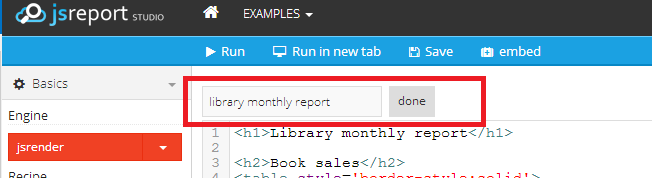
jsreport playground will automatically open the empty report template so we can start with filling the report name.
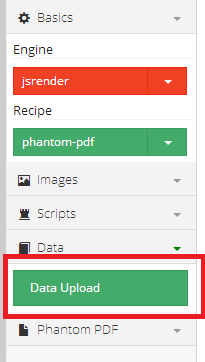
At first it's best to prepare the input testing data. This will make the development of the report much faster. So lets click Data Upload button and fill a following json.
{
  "books": [
    {"name": "A Tale of Two Cities", "author": "Charles Dickens", "sales": 351},
    {"name": "The Lord of the Rings", "author": "J. R. R. Tolkien", "sales": 125},
    {"name": "The Da Vinci Code", "author": "Dan Brown", "sales": 255},
    {"name": "The Hobbit", "author": "J. R. R. Tolkien", "sales": 99}
  ]
}
You can see that input data for report are quite simple. Just collection of books where every book contains the name, author and number of sales. Now hit Save button if you haven't done it before.
After we have testing input data, we can prepare the first part of the books report. That will be just header and simple table with all books. We will use the html => pdf transformation feature of jsreport for this report so we will design it using html. To actually construct html we will use javascript templating engine jsrender that have first class support in jsreport.
So look at the following code snippet and insert it into Content tab in jsreport playground.
<h1>Library monthly report</h1>

<h2>Book sales</h2>
<table style='border-style:solid'>
  <tr>
    <th>Name</th>
    <th>Author</th>
    <th>Sales</th>
  </tr>
  {{for books}}
  <tr>
    <td>{{:name}}</td>
    <td>{{:author}}</td>
    <td>{{:sales}}</td>
  </tr>
  {{/for}}
</table>
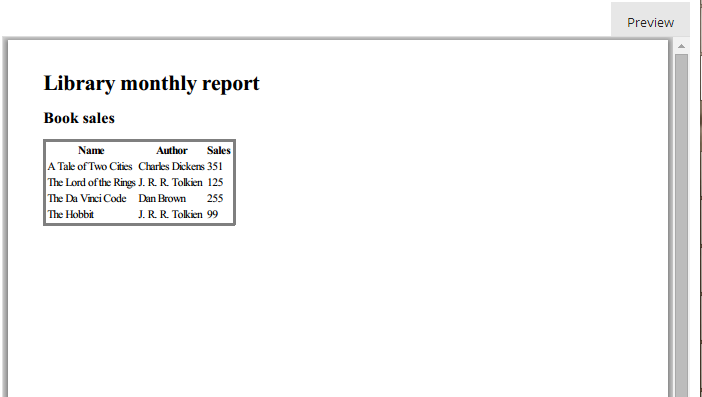
You can see that the html snippet contains some special marks like {{for books}} or {{:name}}. If you aren't already familiar with them, these are the marks of jsrender templating engine. You can use them to construct dynamic html, in this case a html table. I think the code isn't difficult to understand even if you see this templating engine for the first time. So let's click the Run button from toolbar and see the report preview in the right pane. You should get following pdf.
Now we can proceed to the next step. We will add information about the most selling book to the report. This means we need to search for the book with the highest sales attribute in the input collection. We will need a helper javascript function for this. You can define helper function in the Helpers tab in jsreport. So switch there and paste following snippet.
function mostSelling(books) {
  return _.max(books, function(book){ return book.sales; });
}
mostSelling helper function simply searches for the book with highest sales attribute using underscorejs library that is available out of the box. Now you can switch back to the Content tab and add code displaying the functions results.
<h2>The book of the month</h2>
<span>{{:~mostSelling(books).name}}:</span>
<span>{{:~mostSelling(books).sales}}</span>
To call the helper function we use again jsrender marks. In this case it's syntax {{:~[helper name]([args]}}. Now you can click Run again and see the preview.
The last information we should add to report is the chart displaying sales for each book. For charting we can link jquery flot from cdn and it will paint chart for us. We only need to add proper data we want to display. See the snippet.
<h2>Book sales chart</h2>
<script src="//code.jquery.com/jquery-1.11.0.min.js"></script>
<script src="//cdnjs.cloudflare.com/ajax/libs/flot/0.8.1/jquery.flot.min.js"></script>
<script src="//cdnjs.cloudflare.com/ajax/libs/flot/0.8.1/jquery.flot.categories.min.js"></script>
<div id="placeholder" style="width:700px;height:350px"></div>

<script>
$(function () {
  var data = [];
  {{for books}}
      data.push(["{{:#data.name}}", {{:#data.sales}}]);
  {{/for}}

  $.plot("#placeholder", [ data ],
  {
      series: {
       bars: { show: true, barWidth: 0.6, align: "center" }
    },
    xaxis: {   mode: "categories", tickLength: 0 }
  });
});
</script>
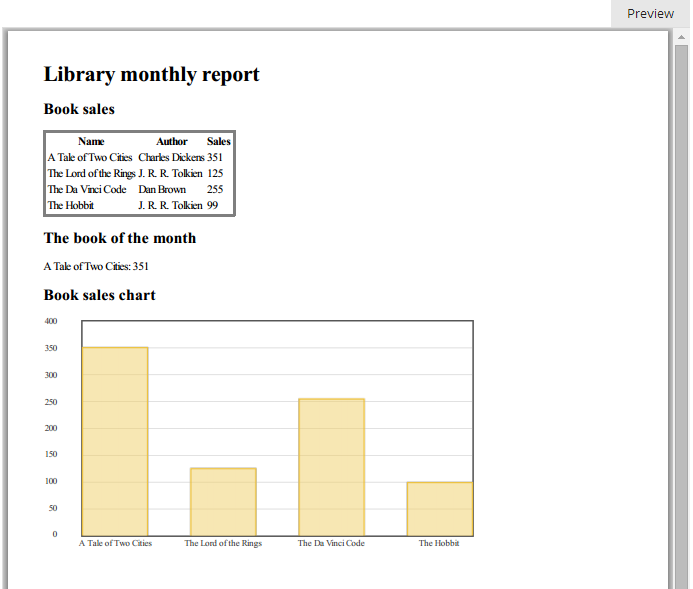
Now you can preview report last time and see the final output.
Report template is ready. Let's create a visual studio project and connect to jsreport API. The console application for the demonstration is just enough, so create empty console project first. jsreport sdk is provided in nuget so you can easily add it to the project by installing jsreport.Client package.
Install-Package jsreport.Client
The main class you will use in jsreport is ReportingService. To instantiate it you would normally need url of the server, username and password, but for the playground lightweight version you don't need any credentials and url is enough. To actually invoke report rendering you need to have input data and jsreport template identification. The input data would come from Library database, but right now we can prepare just some testing data. jsreport template identification can be taken from playground url or using Api button in the full jsreport version. For playground url https://playground.jsreport.net/#/playground/eyaNpy1ho/11 is identification eyaNpy1ho as shortid and 11 as version. Following example shows the full code in c# you need. It will initialize jsreport, call it's api and get back proper stream with pdf report.
class Program
{
  private static void Main(string[] args)
  {
    var service = new ReportingService("https://playground.jsreport.net");

    using (var fileStream = File.Create("report.pdf"))
    {
      //render report and use shortid and version from url in playground
      var report = service.RenderAsync("eyaNpy1ho", 11, new {
                        books = new[] {
             new Book() {name = "A Tale of Two Cities", author = "Charles Dickens", sales = 351},
             new Book() {name = "The Lord of the Rings", author = "J. R. R. Tolkien", sales = 156},
             new Book() {name = "The Da Vinci Code", author = "Dan Brown", sales = 280},
             new Book() {name = "The Hobbit", author = "J. R. R. Tolkien", sales = 170}
         }}).Result;

      report.Content.CopyTo(fileStream);
    }
  }

class Book
{
    public string name { get; set; }
    public string author { get; set; }
    public int sales { get; set; }
}
The finall code from jsreport is accessible here The Visual Studio project is stored at github
Summary
You should now see that jsreport can be an option for reports rendering from c#. It's quite innovative approach which of course has some pros and cons. As the biggest dissadvantage could be seen the lack of visual designer and the fact that jsreport is a server and cannot be just embeded into .NET dll. On the other hand it could be seen as an advantage, because full control over report design will allow you to build any report you want. And separation of reporting responsibility into another process will also make your system better loosely coupled. The biggest advantage is the usage of javascript templating engines which makes doing reports unrestrictive and productive.