Debug jsreport in vscode
08-08-2018 11:30This tutorial shows how to debug and edit jsreport templates using popular editor Visual Studio Code. This brings you full power of desktop editor like intellisense or integrated debugger into the reports development.
Prepare jsreport
First install jsreport using standard steps and make sure jsreport runs correctly on http://localhost:5488
npm install @jsreport/jsreport-cli -g
mkdir jsreportapp
cd jsreportapp
jsreport init
jsreport configure
jsreport start
Then stop jsreport and make the following changes to the configuration file jsreport.config.json.
{
  ...
  "extensions": {
    "fs-store": {
      "externalModificationsSync": true
    }
  }
}
The extensions.fs-store.externalModificationsSync instructs jsreport to monitor external file changes and synchronize them with the studio ui.
Edit templates in vscode
Now you can start jsreport again but this time with the vscode.
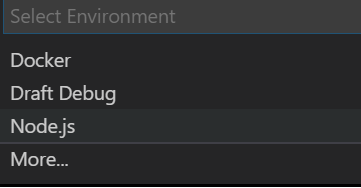
Open the jsreportapp folder with vscode, then hit F5 an choose "node.js".
This should start jsreport and you should be able to reach it again on http://localhost:5488. Open it and then select "Invoice" template and render it. Put the browser on one side or on extra screen and open the vscode. In vscode open the "data/templates/Invoice/content.handlebars", edit it and save. This should initiate action in the browser/studio which reloads the template and run the render again. You should see the updated pdf in a second.
This scenario can be even a bit improved if you use jsreport studio feature to undock the preview. The undock creates extra tab just with the pdf and you don't loose the space with the rest of the studio.
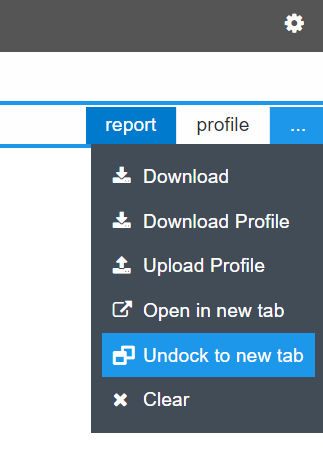
This way you can edit the helpers, scripts or templates directly in the vscode editor and check changes in pdf displayed on a side.
Debug
The vscode already runs in debug. You can put breakpoint to the server.js and it will get hit. However unfortunately it is not so straight forward with jsreport templates. If you put a breakpoint to the "data/templates/Invoice/helpers.js" it won't get hit. This is because jsreport loads and evaluates these files dynamically. Luckily there is a simple way how to debug them.
Just add to the desired place line debugger.
function  now() {
    debugger;
    return new Date().toLocaleDateString()
}
This change should again trigger the reload and render in the studio. The vscode should start the helper debugging at the debugger line.