Live reports
table of contents
jsreport isn't limited for rendering static documents like pdf or excel. You can use it also to render live and user interactive reports. Reports where user can filter data, change the matrix or drill down. This is usually achieved with using the html-with-browser-client recipe together with one of the external javascript data visualization components like D3.js, pivot table, chartjs or any other.

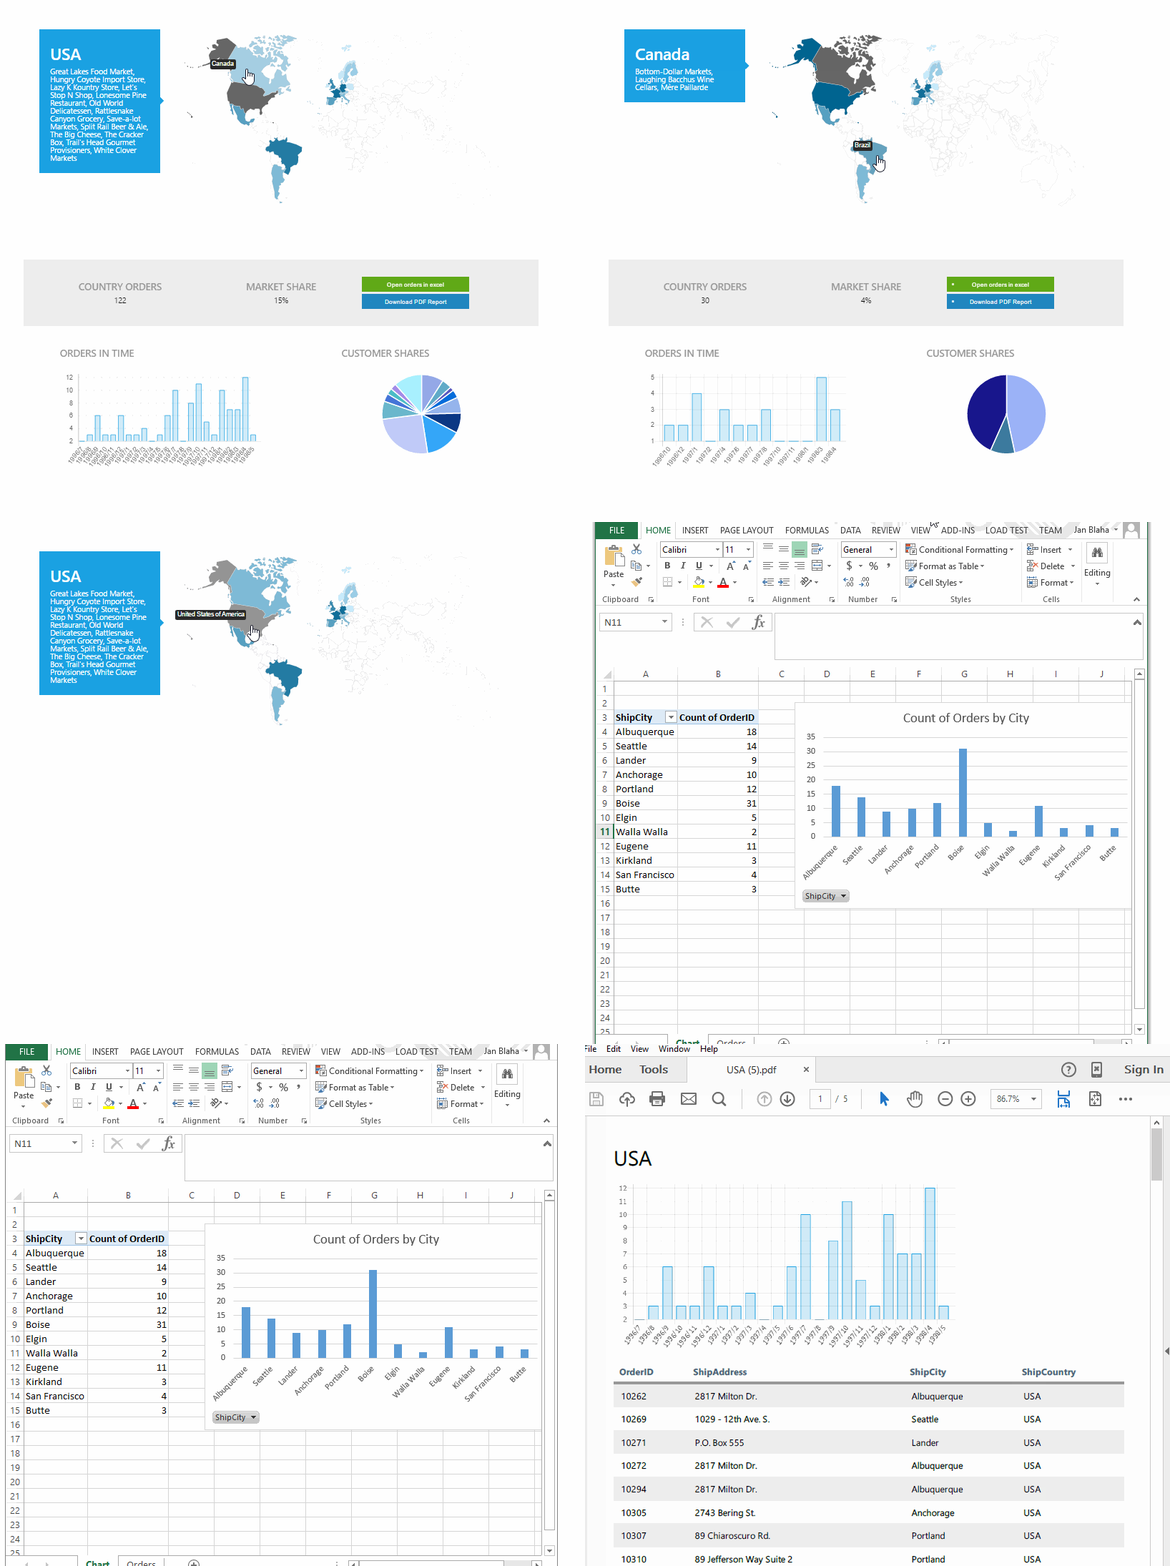
This tutorial explains how to create a simple (master - detail) interactive report. However if you are rather curious how can look like a complex dashboard, don't hesitate to open the links below the image and come back to tutorial afterwards.
Master report template
This tutorial uses NorthWind database and its live REST endpoint as a data source for the reports. The first thing we do is create the master report template and script which downloads the report input data from the endpoint.
The script runs on the server side in node.js sandbox and has full capabilities to connect to any kind of data source like database or in this case REST endpoint. The easiest way to download data from the REST endpoint in the node.js is to install request module. Afterwards it is just about invoking the request and passing the response further to jsreport rendering pipeline.
At this point we just simply use handlebars templating engine and html recipe to render static html table with the downloaded data.
Drilling down
Time to make the report interactive. We need another script downloading particular customer's data, another template displaying customer detail and extend the master customers template with the drill down function.
The script downloading data additionally accepts CustomerID on the input, fetches orders and reduces them by quarter.
The detail template is basically just plain html using input data and chart.js to visualize number of orders in time.
Afterwards we need to change the master template's recipe to the html-with-browser-client. This recipe adds to the page browser client which is used to render the detail template when the user clicks on the customer.
Exporting static report
Quite common functionality of dashboards or interactive reports is exporting into a static document like pdf or excel. This can be done again using html-with-browser-client recipe.
To demonstrate this, the master template needs to be extended with an export button and proper click event handler. In this tutorial the event handler simply renders and downloads the output of the same detail template. It only overrides its recipe to chrome-pdf.
To produce the proper pdf after the chart animation is finished, the detail template was extended with printing trigger which is called in the chart.js callback.
Sharing link to report
Now if you have the working live report, you can share it with others using simple link. You can find the button showing the link in the jsreport toolbar.
If you have authentication enabled, you can also generate anonymous link with access token using Share toolbar button.
