Studio
table of contents
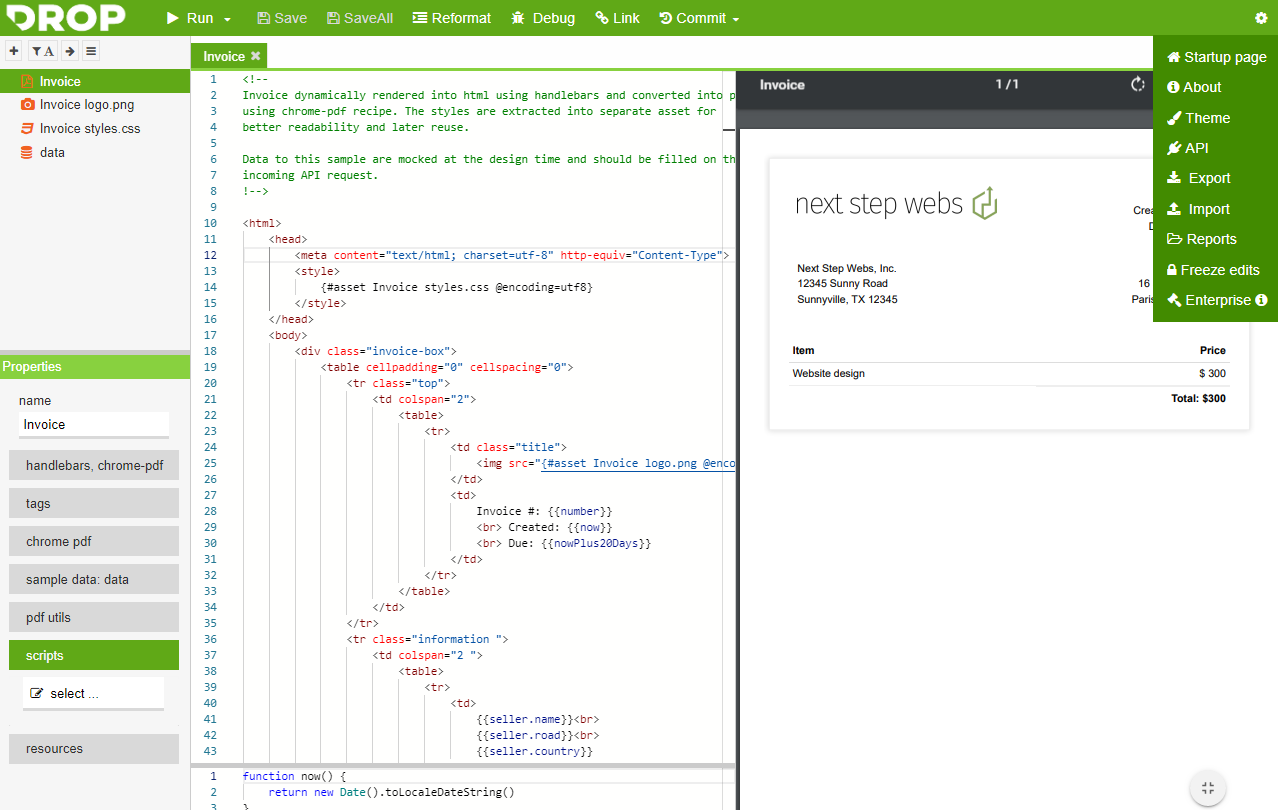
The studio extension provides jsreport UI accessible using a browser.
Profiles
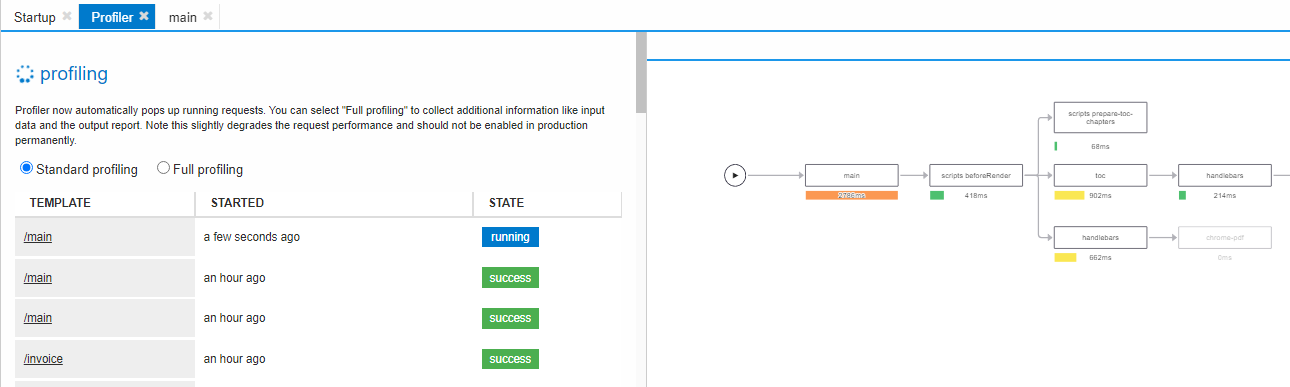
jsreport studio doesn't display just the report output, but it can also display additional information collected from the rendering request in real-time. This can be found in the "profile" tab.
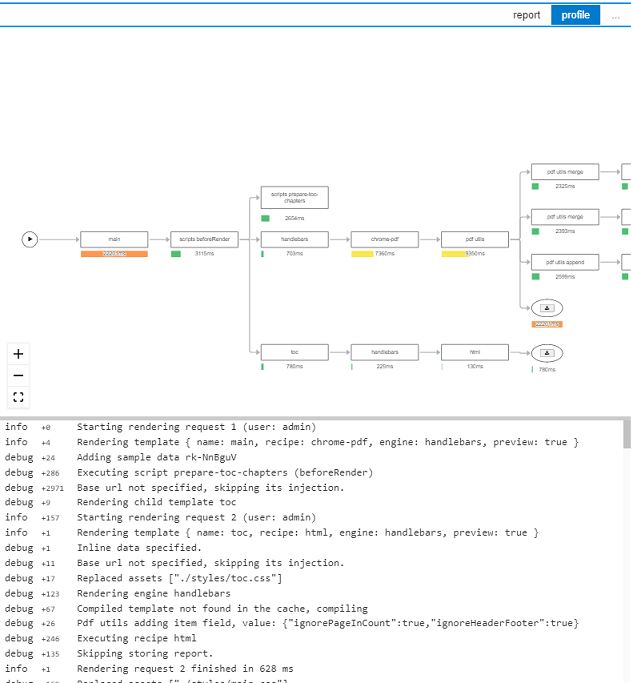
The profiler collects basic information for every rendering request and you can display the diagrams like the one above also for the past requests from the startup page or through the API.
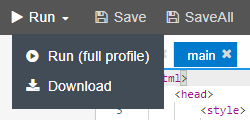
The profiler operates in two modes: "standard profiling" and "full profiling". The first one is the default and collects just the basic information and no input request data. The "standard profiling" is enabled for the studio as well as for all API requests. The "full profiling" mode is opt-in. It can be enabled for particular requests using the "Run" context button "Run (full profile)".
The "full profiling" collects extra information like input and output of every operation running in the rendering pipeline. This means you can download report input and output from the diagram. But also a partial output of the templating engine evaluation for example.
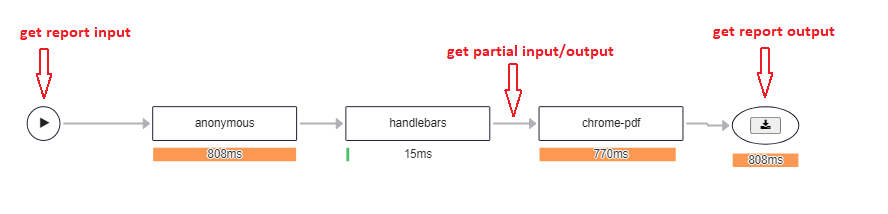
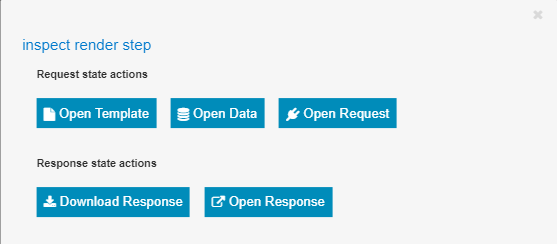
The click to the arrow line between operations pops up a modal dialog with options to display the operation input/output.
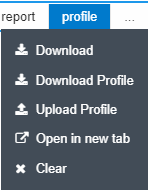
The information provided in the profile can be also downloaded from the studio and shared with other developers when asking for help.
jsreport studio includes an extra profiler page you can use to monitor currently running requests in real-time and display its profiles. The profiler page can be reached from the startup page.
The profiler lets you globaly switch between "standard profiling" and "full profiling". This can be used to collect additional information about the running requests for easier troubleshooting.
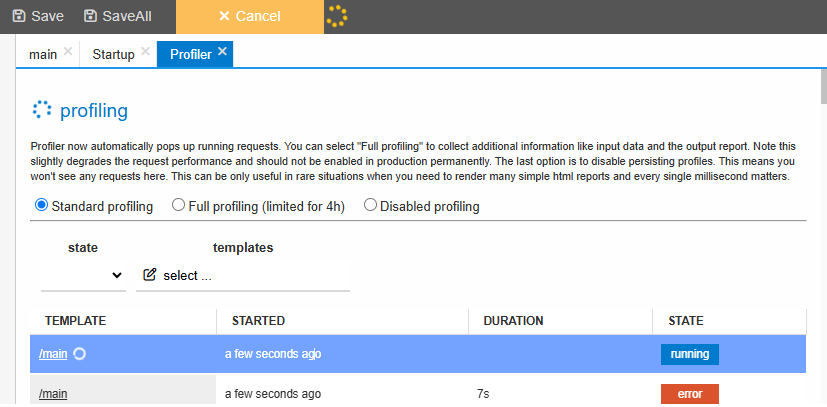
The running report can be canceled from the Profiler page after selection using "Cancel" tool bar menu.
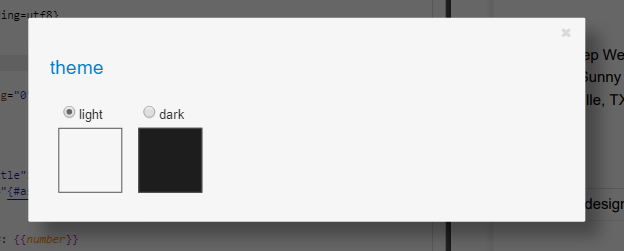
Themes
The jsreport by default comes with a light and dark theme. You can select the theme through the settings menu.
You can install additional themes or implement your own because themes are just standard jsreport extensions. Take a look at how the dark theme code looks.
You can globally change the default light theme to dark using config
extensions.studio.theme.name=dark.
You can additionally select also monaco editor theme using configuration
extensions.studio.theme.editorThemeName=chrome|vs|vs-dark|hc-black
White labeling
You can adapt the studio look and add for example your company logo. You can also change colors or even add your own css.
Favicon
The favicon can be changed using config extensions.studio.favicon which expects path to an image.
Logo
The logo can be changed using config extensions.studio.theme.logo.path which expects path to the image or extensions.studio.theme.logo.base64 which expects string image representation.
Color variables
The colors can be changed using config extensions.studio.theme.variables.primaryColor and others. The full list can be found again using cli command jsreport help config.
Custom css
The path to the custom css can be provided in config extensions.studio.theme.customCss.path or you can pass raw css in config extensions.studio.theme.customCss.content.
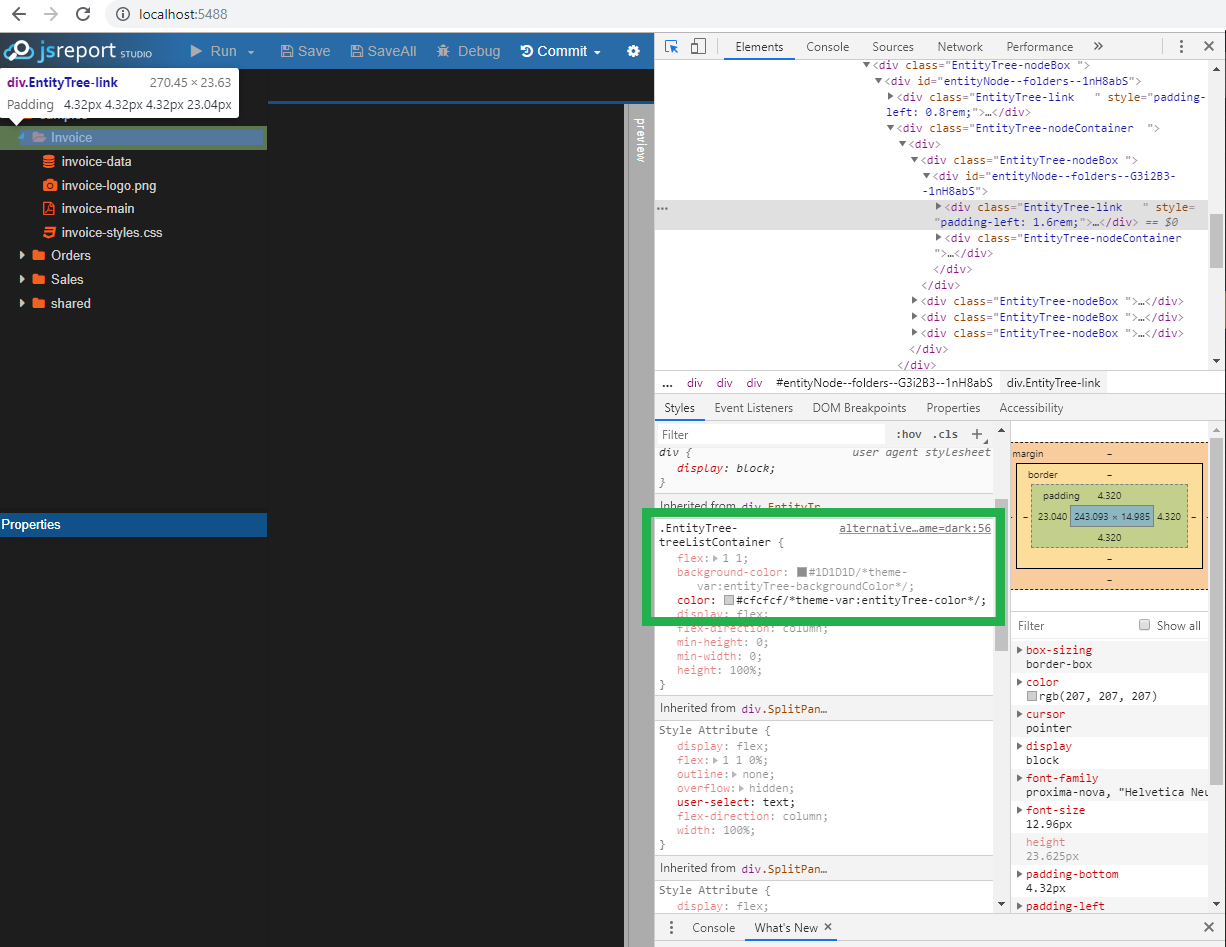
Color variables
The color variables can be general like primary-color for the main text or there're variables also for the specific components like property-heading-color. The full list of variables including its defaults is defined here. The color variables may additionally inherit value, this chain is also described in the linked json.
The easiest way to find out the right variable is using the browser F12 developer tools. Select an element you want to style and check its color definition. The varaible name is written in comment theme-var: variablename. Just keep in mind the inheritance because the actual color can be defined in the parent.