Charts in pdf reports
04-18-2014 15:09Update: highchart library seems to perform much better then jquery.flot and we recommend using hightchart instead. You only need to to disable animations. See example
jsreport phantom-pdf recipe allows you to convert any html, css and javascript into pdf page. This means you can even link a javascript charting library, let it render an image or svg chart and jsreport phantom-pdf recipe will still be able to print them into pdf.
Online example is accesible here
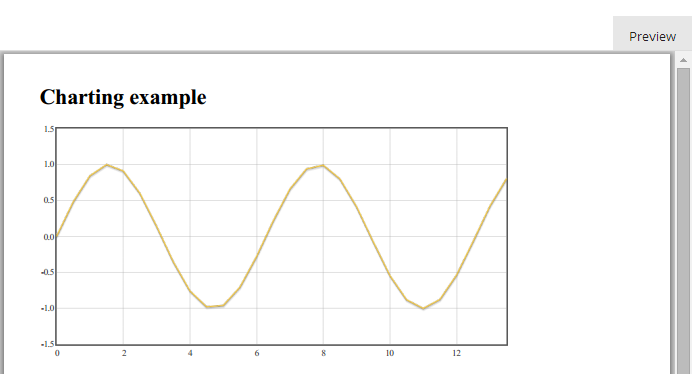
Look at the following example. It shows how to do a simple chart in jsreport. It uses jquery and jquery flot charting library to render a very simple chart. Note also that jsreport allows you to link javascript libraries from cdn so you don't have to embed the whole code into report.
<h1>Charting example</h1>

<script src="http://code.jquery.com/jquery-1.11.0.min.js"></script>
<script src="http://cdnjs.cloudflare.com/ajax/libs/flot/0.8.1/jquery.flot.min.js"></script>

<div id="placeholder" style="width:700px;height:350px"></div>

<script>
$(function () {

    var d1 = [];
    for (var i = 0; i < 14; i += 0.5) {
        d1.push([i, Math.sin(i)]);
    }

    $.plot("#placeholder", [d1]);
});
</script>